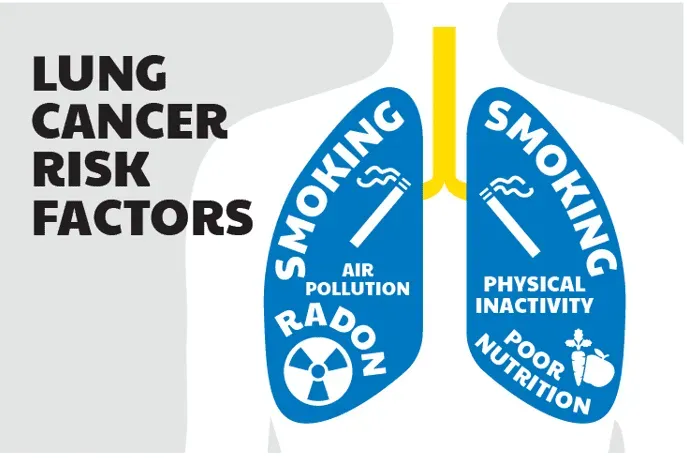
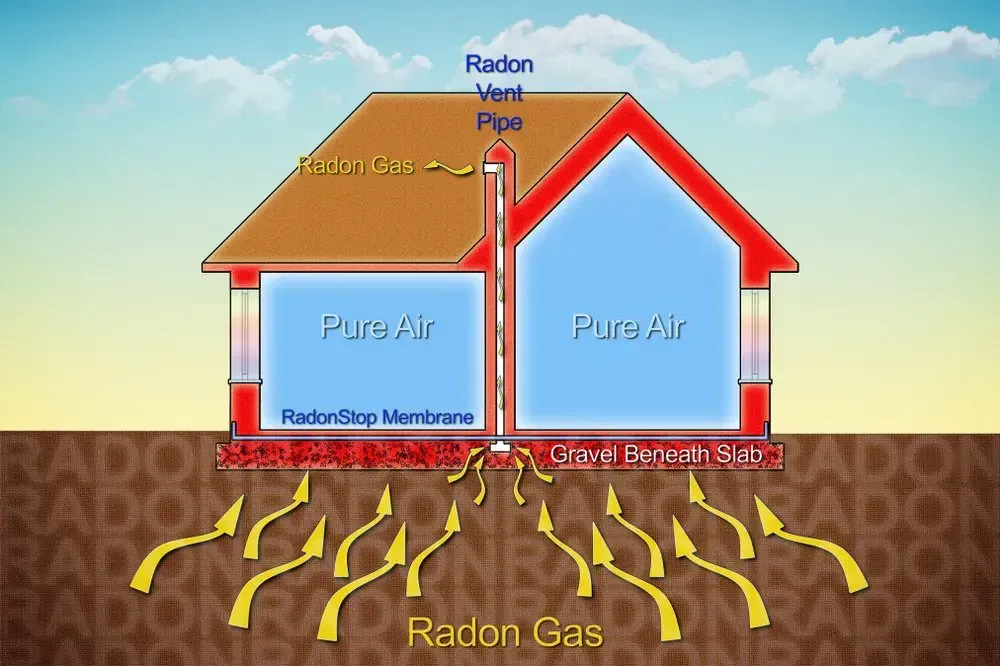
Radon is a naturally occurring, radioactive gas that is produced by the decay of uranium in soil, rock, and water. Radon can seep into homes and buildings through cracks in foundations, walls, and floors, and can accumulate to levels that are harmful to human health. In fact, radon is the second leading cause of lung cancer in the United States, after smoking. Keep reading to see the Utah radon map and where radon is most prevalent.
The
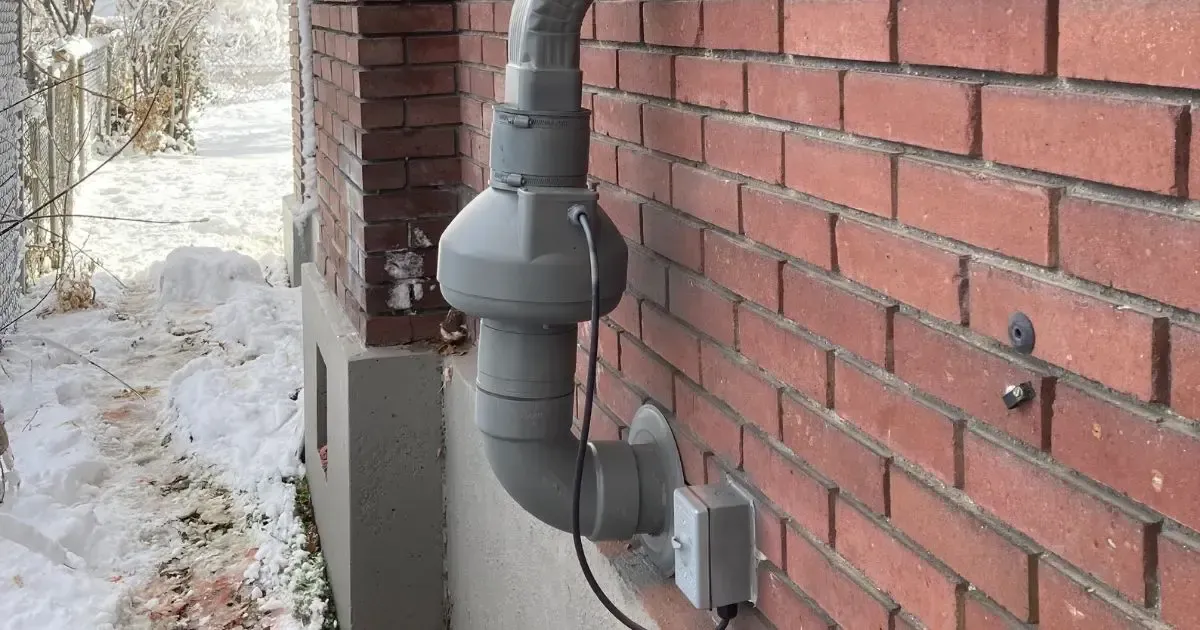
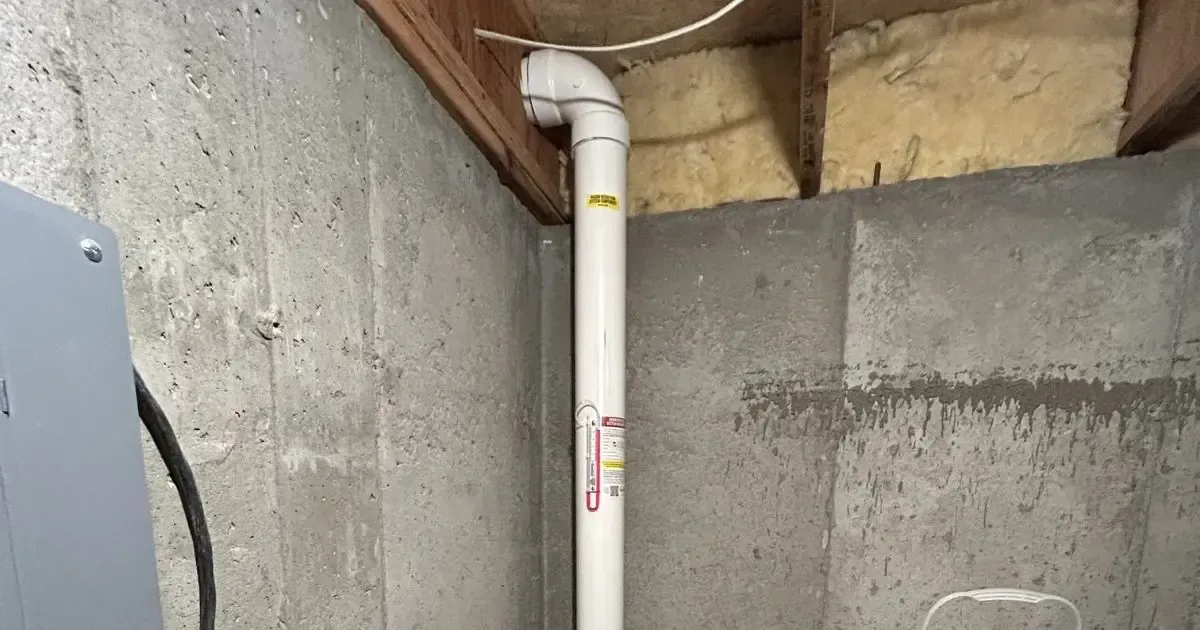
Environmental Protection Agency (EPA) has established a standard of 4 picocuries per liter (pCi/L) of air as the action level for radon. If radon levels in a home or building exceed this level, the EPA recommends you take measures to reduce radon exposure. These measures may include sealing cracks in foundations and walls, improving ventilation, or installing a radon mitigation system.
Get a Free Quote
Where is Radon Gas Common?
The risk of radon exposure varies depending on the geology of the region. The EPA has developed a radon map of the United States that identifies areas with higher radon potential. The map is based on data from thousands of radon measurements across the country. The map is color-coded to show areas with different levels of radon potential, ranging from low to high.
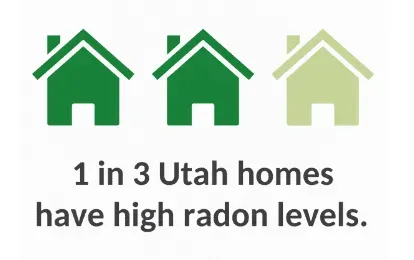
One state that is particularly at risk for radon exposure is Utah. In fact, Utah has the highest average radon levels in the country, with nearly 1 in 3 homes in Utah having radon levels above the EPA action level.
Utah Radon Map
The Utah radon map, created by the Utah Geological Survey, shows that the risk of radon exposure varies widely across the state. The map is based on data from more than 33,000 radon tests conducted throughout the state.
Our radon map is color-coded and shows areas with different levels of radon potential. Areas in green have the lowest radon potential, while areas in red have the highest potential. The map shows that the highest radon potential is in the northern and eastern parts of the state, particularly in Cache, Rich, and Summit Counties. The areas with the lowest radon potential are in the southwestern part of the state, particularly in Washington and Iron Counties.
The Utah radon map is important for several reasons. First, it helps homeowners and buyers to identify areas of the state that are at higher risk for radon exposure. If you live in an area with higher radon potential, it is important to test your home for radon and take steps to reduce radon levels if necessary.
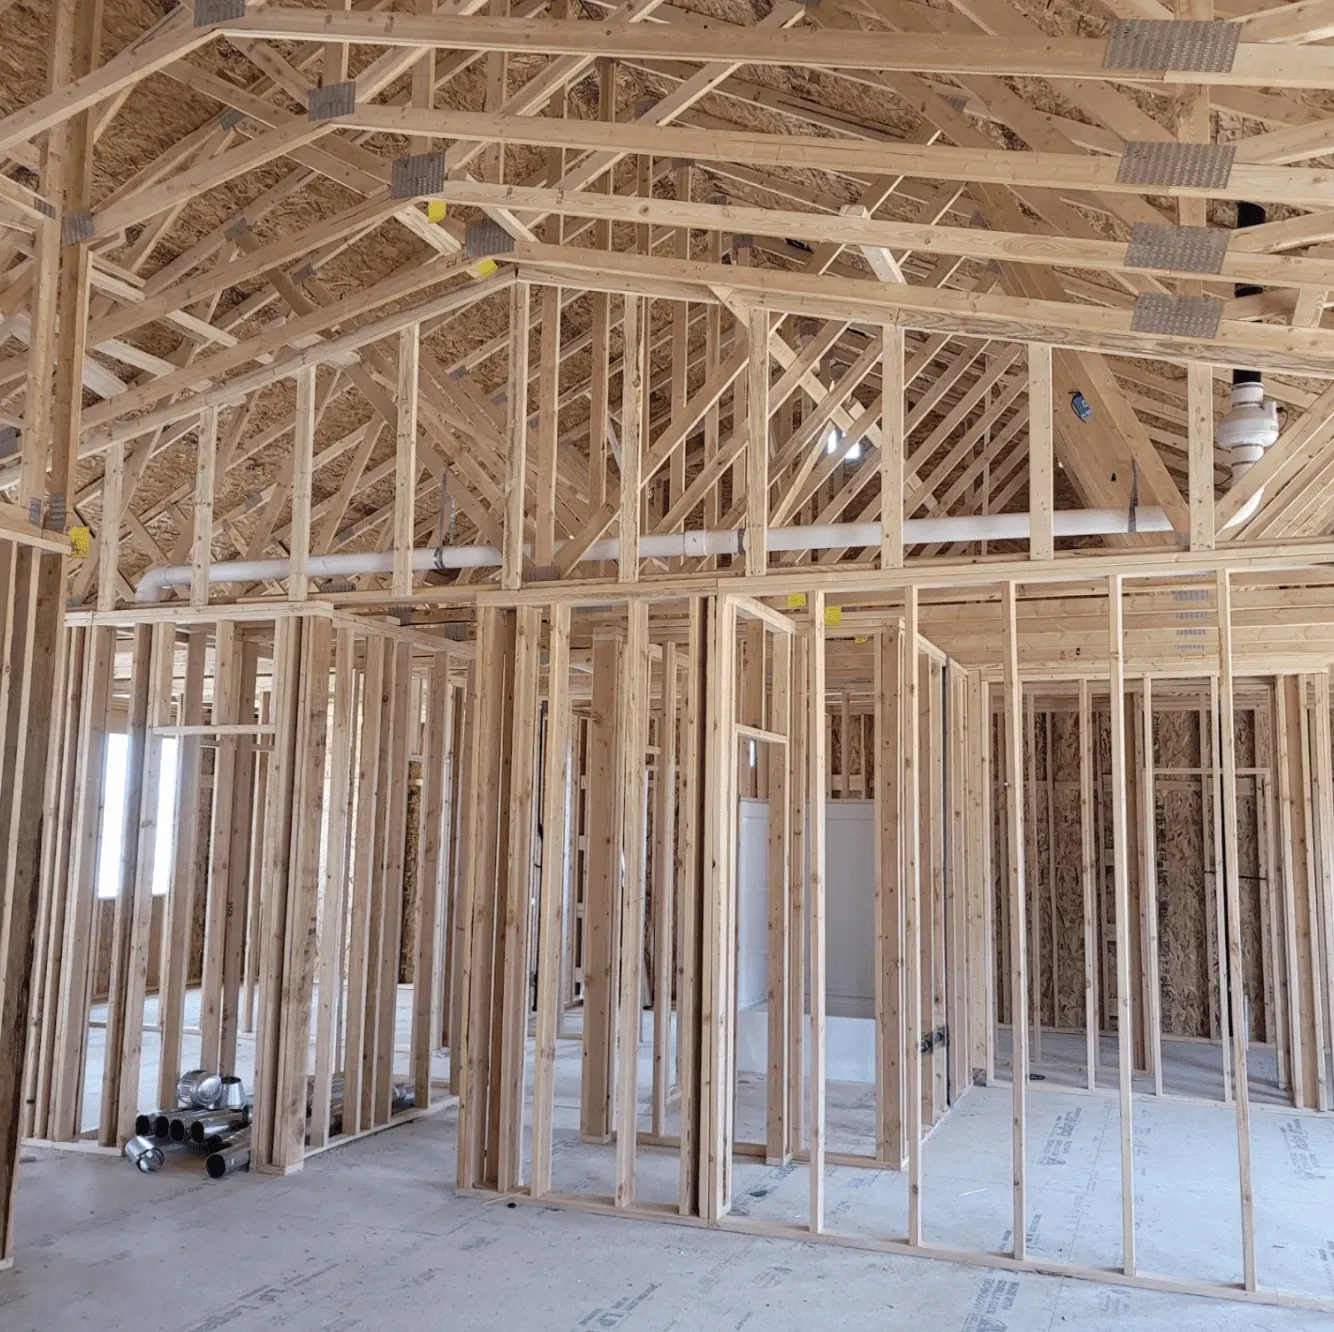
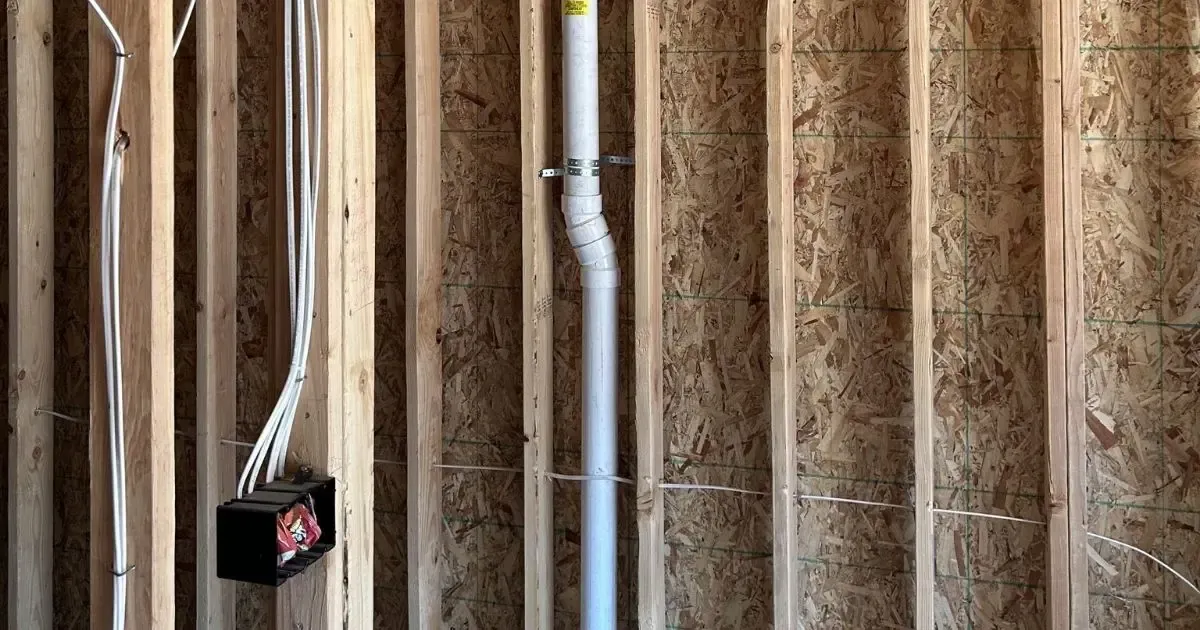
Second, builders and developers can use our map to design homes and buildings that are more resistant to radon infiltration. For example, building homes with radon-resistant features, such as sealed foundations and vent pipes, can reduce the risk of radon exposure.
Third, public health officials can use our map to target radon outreach and education efforts. By focusing on areas with higher radon potential, officials can raise awareness of the risks of radon exposure and encourage residents to test their homes for radon.
Test Your Home for Radon in Utah
Overall, the Utah radon map is an important tool for identifying areas of the state that are at higher risk for radon exposure. If you live in Utah, it is important to be aware of the radon potential in your area and to test your home for radon. By taking steps to reduce radon levels, you can help protect yourself and your family from the harmful effects of radon exposure. Remember, the only way to know your radon level is to test. Even if homes in your area are coming back with lower radon levels, your home could be different. Please test to make sure.
Order a test kit from us or
give us a call for radon mitigation.
Get a Free Quote
![Blue periodic table tile for radon, element 86, with symbol Rn and mass [222].](https://le-cdn.hibuwebsites.com/09c3a4288d5947b58ca8220076f73b94/dms3rep/multi/opt/radon-periodic-table-rn-86-radon-be-gone-1920w.webp)